Table of Contents
The graphs created withing this project
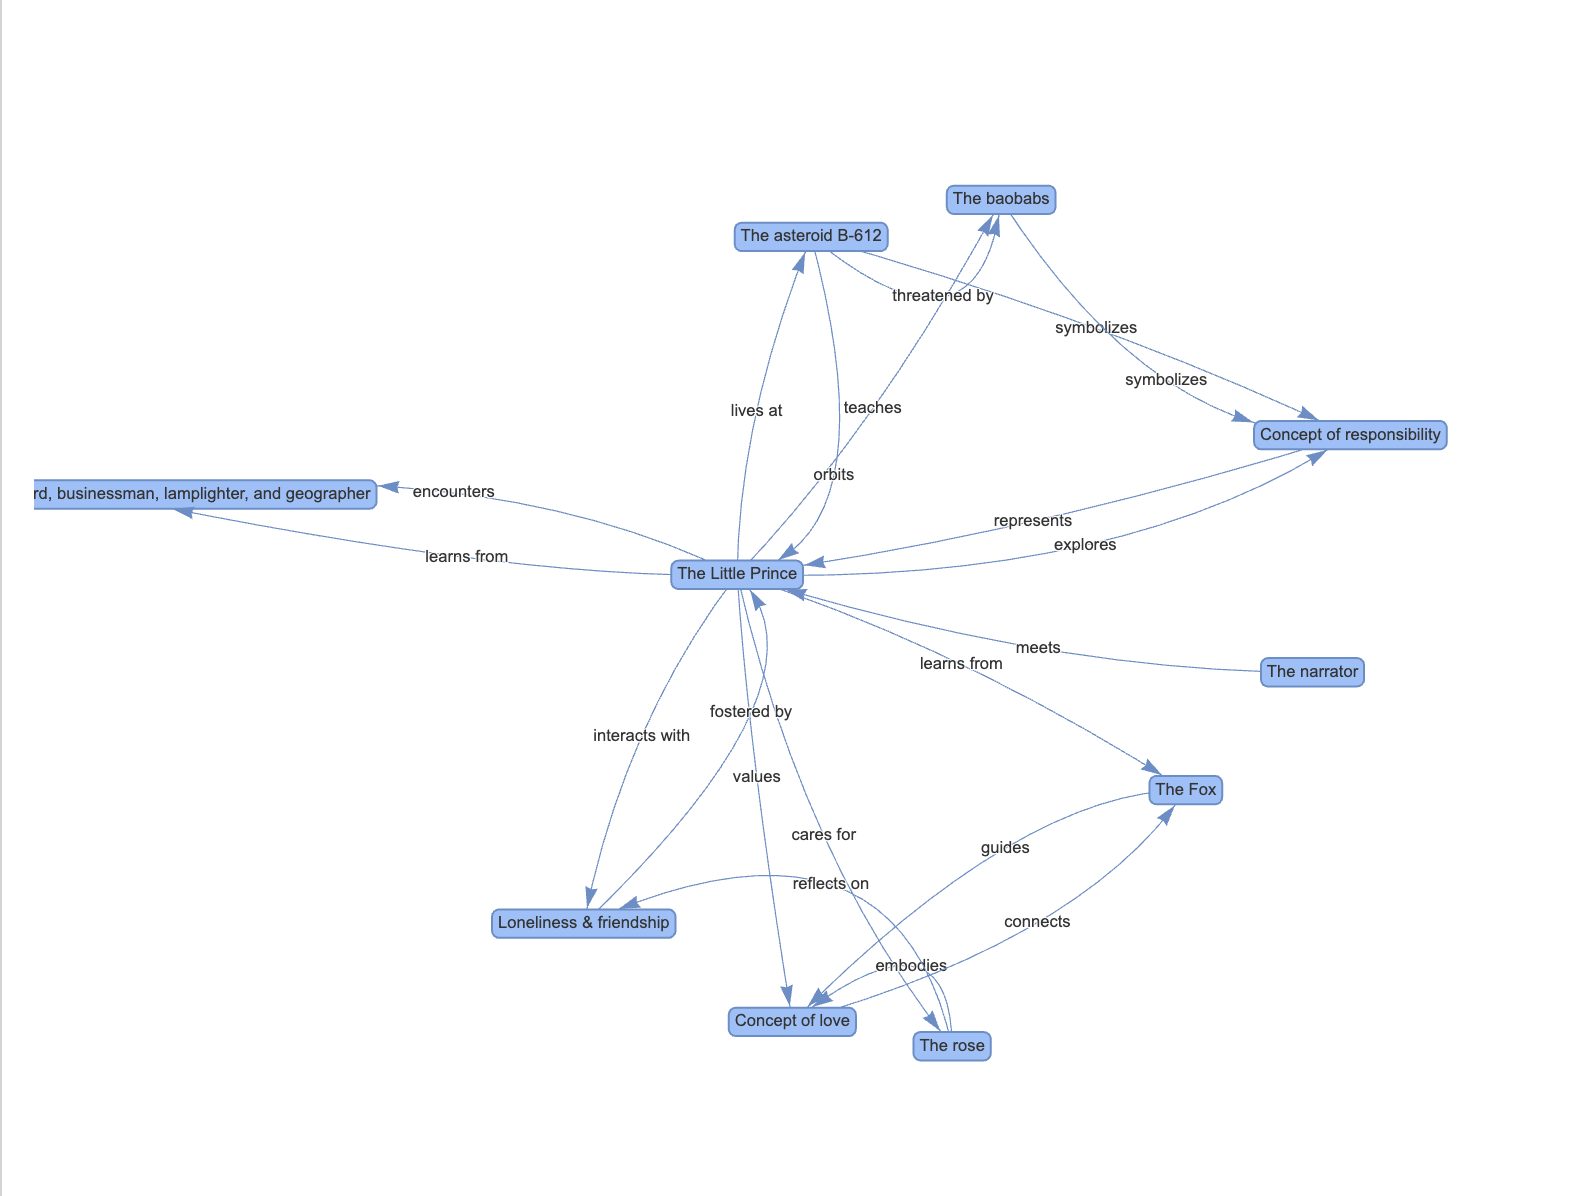
An image of the knowledge graph created for the little prince

Introduction
Large language models like ChatGPT have the remarkable ability to extract information from documents and present it in a concise and easy to undertand format. However, the standard ChatGPT output of chatGPT is limited to text and images. In this article, we will explore how to leverage ChatGPT’s capabilities and constrain its output to create visually appealing knowledge graphs that summarize books similar to this this graph that symmarizes the famous “A tale of two cities”
The reason why I wanted to investigate Knowledge graph visualizations is because they can be a powerful educational tool when used in conjunction with reading a book. It’s important to note that these graphs are not meant to replace the act of reading itself, as they cannot fully capture the depth and nuance of the text. In fact, the graph may not be very useful without the context and knowledge gained from actually reading the book. However, knowledge graphs can serve as a valuable aid, especially when readers find themselves lost or overwhelmed in the middle of a complex book. By providing a high-level overview of the main concepts and their relationships, these visualizations can help readers regain their bearings and see the bigger picture. This can make it easier to understand how different parts of the book fit together and contribute to the overall message or theme.
To summarize, although knowledge graphs is a handy tool to supplement and enhance the learning experience of reading a book by providing a clear, visual representation of the book’s key ideas and their connections.
Examples of knowledge graphs
Below are some examples of knowledge graphs for well-known books. Clicking on a link will display the corresponding knowledge graph. When you hover over a node or link in the graph, you will see a description of that particular node or link, providing more context and information about its significance within the book’s narrative or structure.
In the rest of this article I will describe the to generate the graphs above:
Implementation
The code to generate knowledge graphs from book summaries using ChatGPT is available in this GitHub repo. The process is straightforward and involves the following steps:
- Define a Pydantic model to specify the structure of the knowledge graph. The graph consists of nodes and links, where each node represents a main concept and each link represents a connection between two concepts. The Pydantic model is defined as follows:
from pydantic import BaseModel
from typing import List

class Node(BaseModel):
    node_id: int
    name: str
    description: str

class Link(BaseModel):
    link_id: int
    link_name: str
    node_id_from: int
    node_id_to: int
    link_description: str

class KnowledgeGraph(BaseModel):
    concepts: List[Node]
    links: List[Link]
    name: str
- Prompt ChatGPT to generate a JSON object that adheres to the specified Pydantic model. The prompt instructs ChatGPT to summarize a given book title into a knowledge graph with 10 nodes and 20 links, ensuring that the resulting graph is visually appealing and provides a good overview of the book. The
instructorlibrary is used to constrain ChatGPT’s output to match the Pydantic model.
from functools import lru_cache
from openai import OpenAI
from typing import List
import instructor

@lru_cache(maxsize=None)
def get_knowledge_graph_object(
    book_title: str,
    model: str = 'gpt-4-turbo',
    client = instructor.from_openai(OpenAI())
) -> KnowledgeGraph:
    return client.chat.completions.create(
        model=model,
        response_model=KnowledgeGraph,
        messages=[
            {"role": "system", "content": "You are an avid reader and you summarize books in knowledge graphs and make it entertaining"},
            {"role": "user", "content": f"""Summarize the book {book_title} in the graph given as type. Each of the nodes in the graph represents one main concept of the book. Each of the links represents a connection between two main concepts. The graph should have 10 nodes and 20 links. The resulting graph should be visually appealing and give a good global understanding of the book it summarizes. Take some time and reason step by step before creating the graph object to make a graph that will be easy to display. A node should not have self-loops and there should not be loops between two nodes. The graph should give the reader a good summary of the book."""}
        ],
    )
- Parse the generated Pydantic model and visualize it as a knowledge graph using the
pyvislibrary.
from pyvis.network import Network

def draw_kg_with_pyvis(knowledge_graph: KnowledgeGraph):
    net = Network(notebook=True, directed=True, width="800px", height="600px")

    # Add nodes to the network
    for node in knowledge_graph.concepts:
        net.add_node(node.node_id, label=node.name, title=node.description.replace('.', '.\n'), shape="box")

    # Add edges to the network
    for link in knowledge_graph.links:
        net.add_edge(link.node_id_from, link.node_id_to, label=link.link_name, title=link.link_description.replace('.', '.\n'))

    # Set layout options
    net.barnes_hut(gravity=-1000, overlap=100)

    # Display the network
    return net.show(f"{knowledge_graph.name}.html")
By following these steps, you can leverage the power of ChatGPT to generate informative and visually appealing knowledge graphs that summarize books. The instructor library ensures that the generated output adheres to the specified Pydantic model, while the pyvis library enables the visualization of the knowledge graph in an interactive and user-friendly format.
Conclusion
In this article I shared with you some cool things you can do by combining the power of structured generation and python plotting library to create pretty chatGPT powered vizualization using chatGPT. Please have a look at the vizualisations I already created here
Looking forward to receive your feedback at robin.nicole.m@gmail.com
About the author (Robin Nicole)
I finished my PhD in 2017 and am now an Applied Scientist working on digital marketing for the tourism sector. I am both interested and impressed by LLMs and their potential to affect intellectual labour the same way lever affected manual labour. I love to share my passion about this topic, so if you have any question or just want to have a chat please reach out to me on my Linkedin or by mail robin.nicole.m@gmail.com.