Introduction
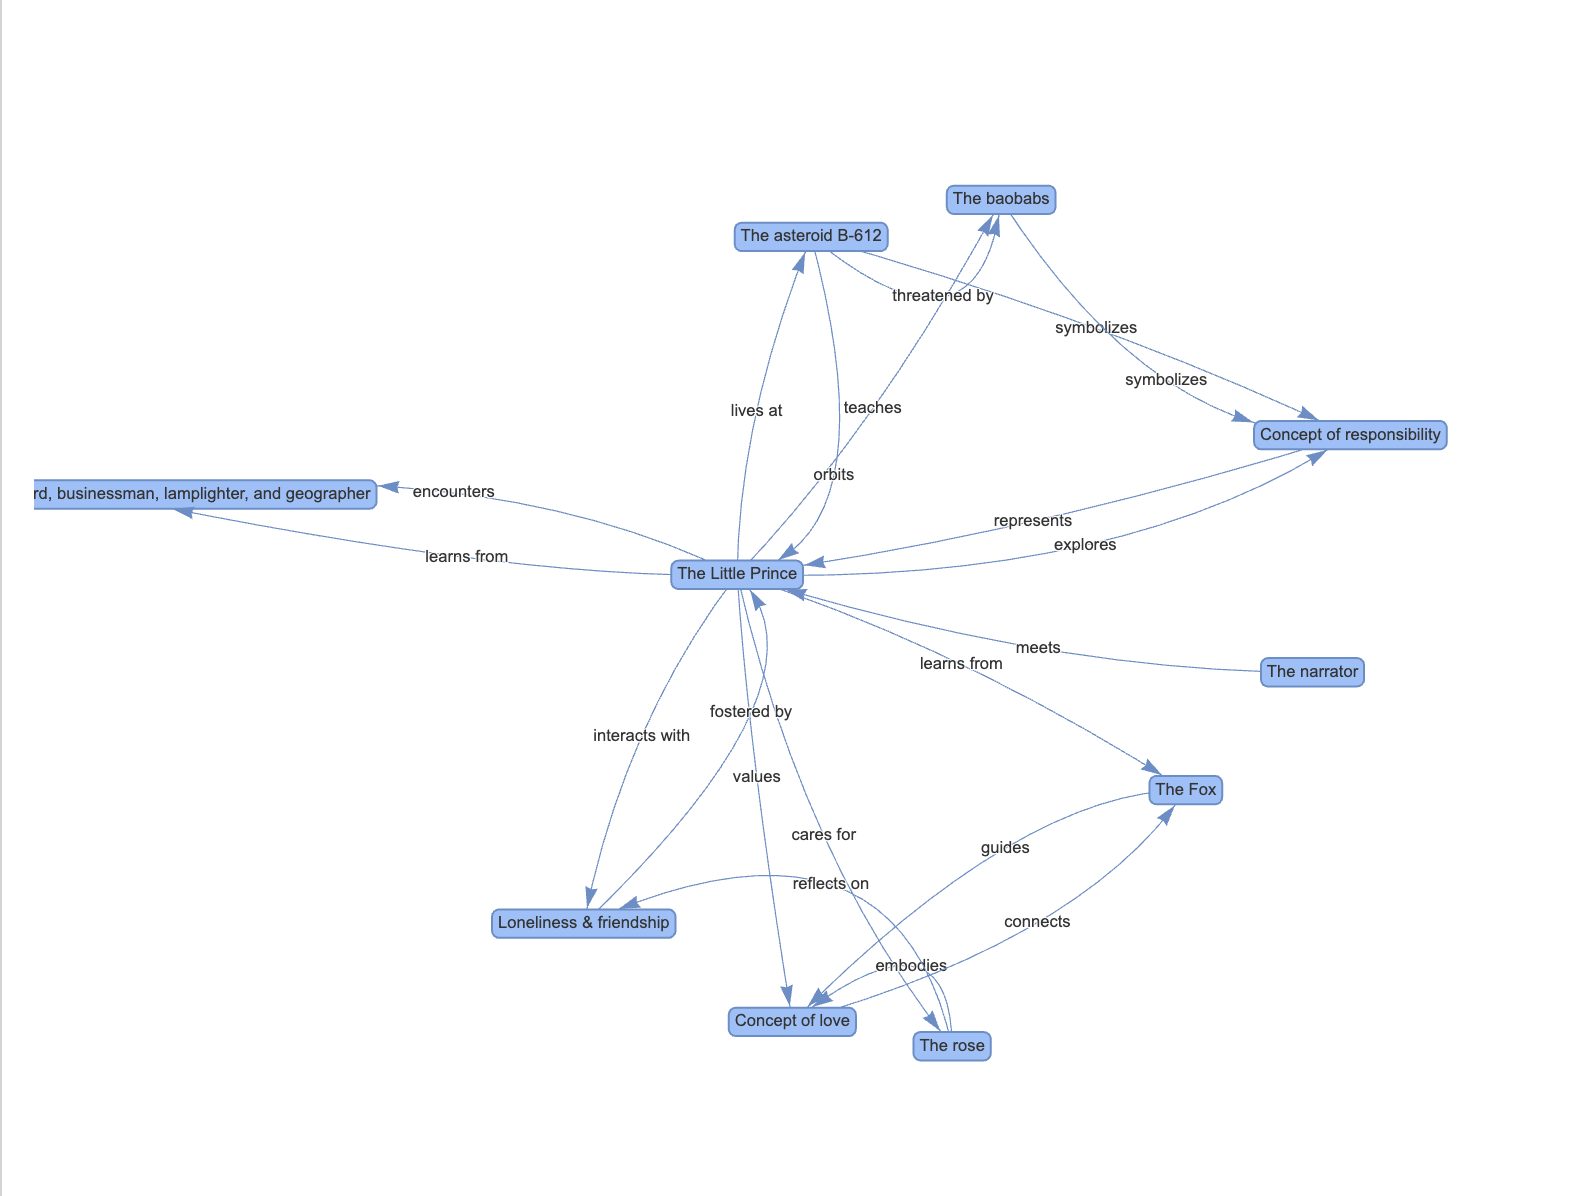
ChatGPT is good at reading a document and handing you back the gist. What it gives you, though, is a wall of text. But text is a one-dimensional readout of something that isn’t: a book is a web of characters, places, and ideas that point at each other. So I wanted to force the output into that shape, to stop asking the model for prose and ask it for a data structure instead, a set of nodes and edges you can then draw. The result looks like the graph above.
One caveat before the demo. A graph like this does not replace reading the book; hand it to someone who has never opened the novel and it’s close to noise. It earns its keep in the middle of a long, tangled book, when you’ve lost track of who is related to whom and why a scene 200 pages ago matters now. Think of it as a map you consult when lost, not a substitute for the journey.
The graphs
Click a link to open one. Hover over any node or edge for a description of what it represents.
Implementation
The full code lives in this GitHub repo. There are only three moving parts.
First, describe the shape you want with a Pydantic model: a set of nodes, each a concept, and a set of links between them. This is the contract the model has to fill in.
from pydantic import BaseModel
from typing import List

class Node(BaseModel):
    node_id: int
    name: str
    description: str

class Link(BaseModel):
    link_id: int
    link_name: str
    node_id_from: int
    node_id_to: int
    link_description: str

class KnowledgeGraph(BaseModel):
    concepts: List[Node]
    links: List[Link]
    name: str
Second, ask the model to fill it in. The prompt says: summarize this book as a graph with 10 nodes and 20 links, no self-loops, no duplicate edges. The instructor library does the real work here, it constrains the output so you get back an actual KnowledgeGraph object and not a string you have to parse and pray over. The 10-and-20 numbers are arbitrary; they’re just what looked readable on screen. Push them higher and the graph turns into spaghetti.
from functools import lru_cache
from openai import OpenAI
from typing import List
import instructor

@lru_cache(maxsize=None)
def get_knowledge_graph_object(
    book_title: str,
    model: str = 'gpt-4-turbo',
    client = instructor.from_openai(OpenAI())
) -> KnowledgeGraph:
    return client.chat.completions.create(
        model=model,
        response_model=KnowledgeGraph,
        messages=[
            {"role": "system", "content": "You are an avid reader and you summarize books in knowledge graphs and make it entertaining"},
            {"role": "user", "content": f"""Summarize the book {book_title} in the graph given as type. Each of the nodes in the graph represents one main concept of the book. Each of the links represents a connection between two main concepts. The graph should have 10 nodes and 20 links. The resulting graph should be visually appealing and give a good global understanding of the book it summarizes. Take some time and reason step by step before creating the graph object to make a graph that will be easy to display. A node should not have self-loops and there should not be loops between two nodes. The graph should give the reader a good summary of the book."""}
        ],
    )
Third, draw it. The object is just nodes and edges, so any graph library will do; I used pyvis because it spits out an interactive HTML file you can pan and hover.
from pyvis.network import Network

def draw_kg_with_pyvis(knowledge_graph: KnowledgeGraph):
    net = Network(notebook=True, directed=True, width="800px", height="600px")

    # Add nodes to the network
    for node in knowledge_graph.concepts:
        net.add_node(node.node_id, label=node.name, title=node.description.replace('.', '.\n'), shape="box")

    # Add edges to the network
    for link in knowledge_graph.links:
        net.add_edge(link.node_id_from, link.node_id_to, label=link.link_name, title=link.link_description.replace('.', '.\n'))

    # Set layout options
    net.barnes_hut(gravity=-1000, overlap=100)

    # Display the network
    return net.show(f"{knowledge_graph.name}.html")
That’s the whole pipeline: a schema, a constrained call, a plotting library.
Conclusion
The lesson is bigger than book summaries. Once you can pin the model’s output to a schema, the LLM stops being a thing you read and becomes a component you can wire into a program. Here the schema was a graph and the program was a plot; swap either one and the recipe carries over.